Tracing end-to-end requests in a distributed architecture
If we visualize a distributed architecture like a black-box, in order to tracing end-to-end requests to track down errors, bugs and performance losses the keystone is to assign a unique hash/fingerprint each client-request to the black-box. Done that, we can pass this request hash to all of internal microservices that are called to handle the request letting the microservices do logging, write down meta information (e.g. processing time) and raise exceptions putting together the request hash. Since all of these stuff will be bound to the originary request unique hash we have like a fil-rouge that can link together all of taken individually microservices requests.
Clearly, we have to use centralized data collectors: for logging (e.g. Logstash), for exception handling & monitoring (e.g. Sentry) and for writing down meta information (e.g. Elasticsearch, MongoDB). What if we don’t want to reinvent the wheel? Well, there are many (opensource) tools to do that efficiently.
One of those is OpenTracing ecosystem
OpenTracing is a widely adopted API (e.g. by Jaeger or Zipkin) that defines how to capture distributed traces.
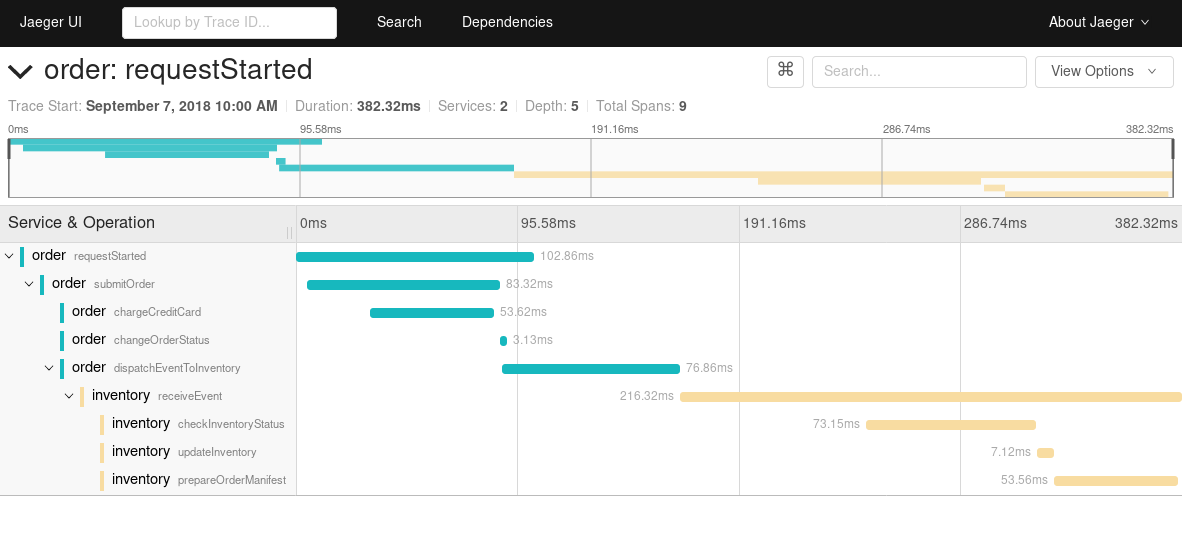
In OpenTracing we can model each captured event (that is, from one microservice) as a “span”. Every “span” can carry a “context”, to store key:value pairs. Every “span” can be related to another “span” with “child-of” or “follows-from” relation.
Having those objects in mind, we can easily leverage them in OpenTracing through tracer.inject(...) / tracer.extract(...) methods.
Example:
NodeJs makes a RPC call → Apache Kafka → Rust Server processes the call
Let’s say we have a NodeJS application that it is getting a client-request and to process that request it has to call a RPC written in Rust through Kafka. Since the NodeJS app it’s the “root span”, it creates a trace ID.
Now, to be able to track it through a Kafka message we need to inject it into a custom header that will propagate to the next “span context” and to do that we can call Tracer.inject(spanContext) to enrich the “carrier”, then we can easily extract spanContext from the carrier for continuing trace in the server.
Finally, leveraging distributed tracing let us to have an ensemble view of the system, tracking down not just perfomance at node level but treating the entire system like a black-box.